Observe
Historical traffic, hourly progress, weather, calendar effects, and the current day.
A forecasting and labor planning system currently used at Apple Valley Mister Car Wash as “Mister Forecast.” It gives operators a clear answer while the day is still unfolding.
The operational problem
Car wash demand is unusually volatile. Weather, seasonality, holidays, school calendars, and local conditions can move volume dramatically. Managers still have to decide throughout the day whether staffing is appropriate.
Overstaffing wastes labor. Understaffing harms the customer experience and burns out the team. Future scheduling had the same problem: plenty of historical data, but no practical way to translate it into a decision.
The central decision
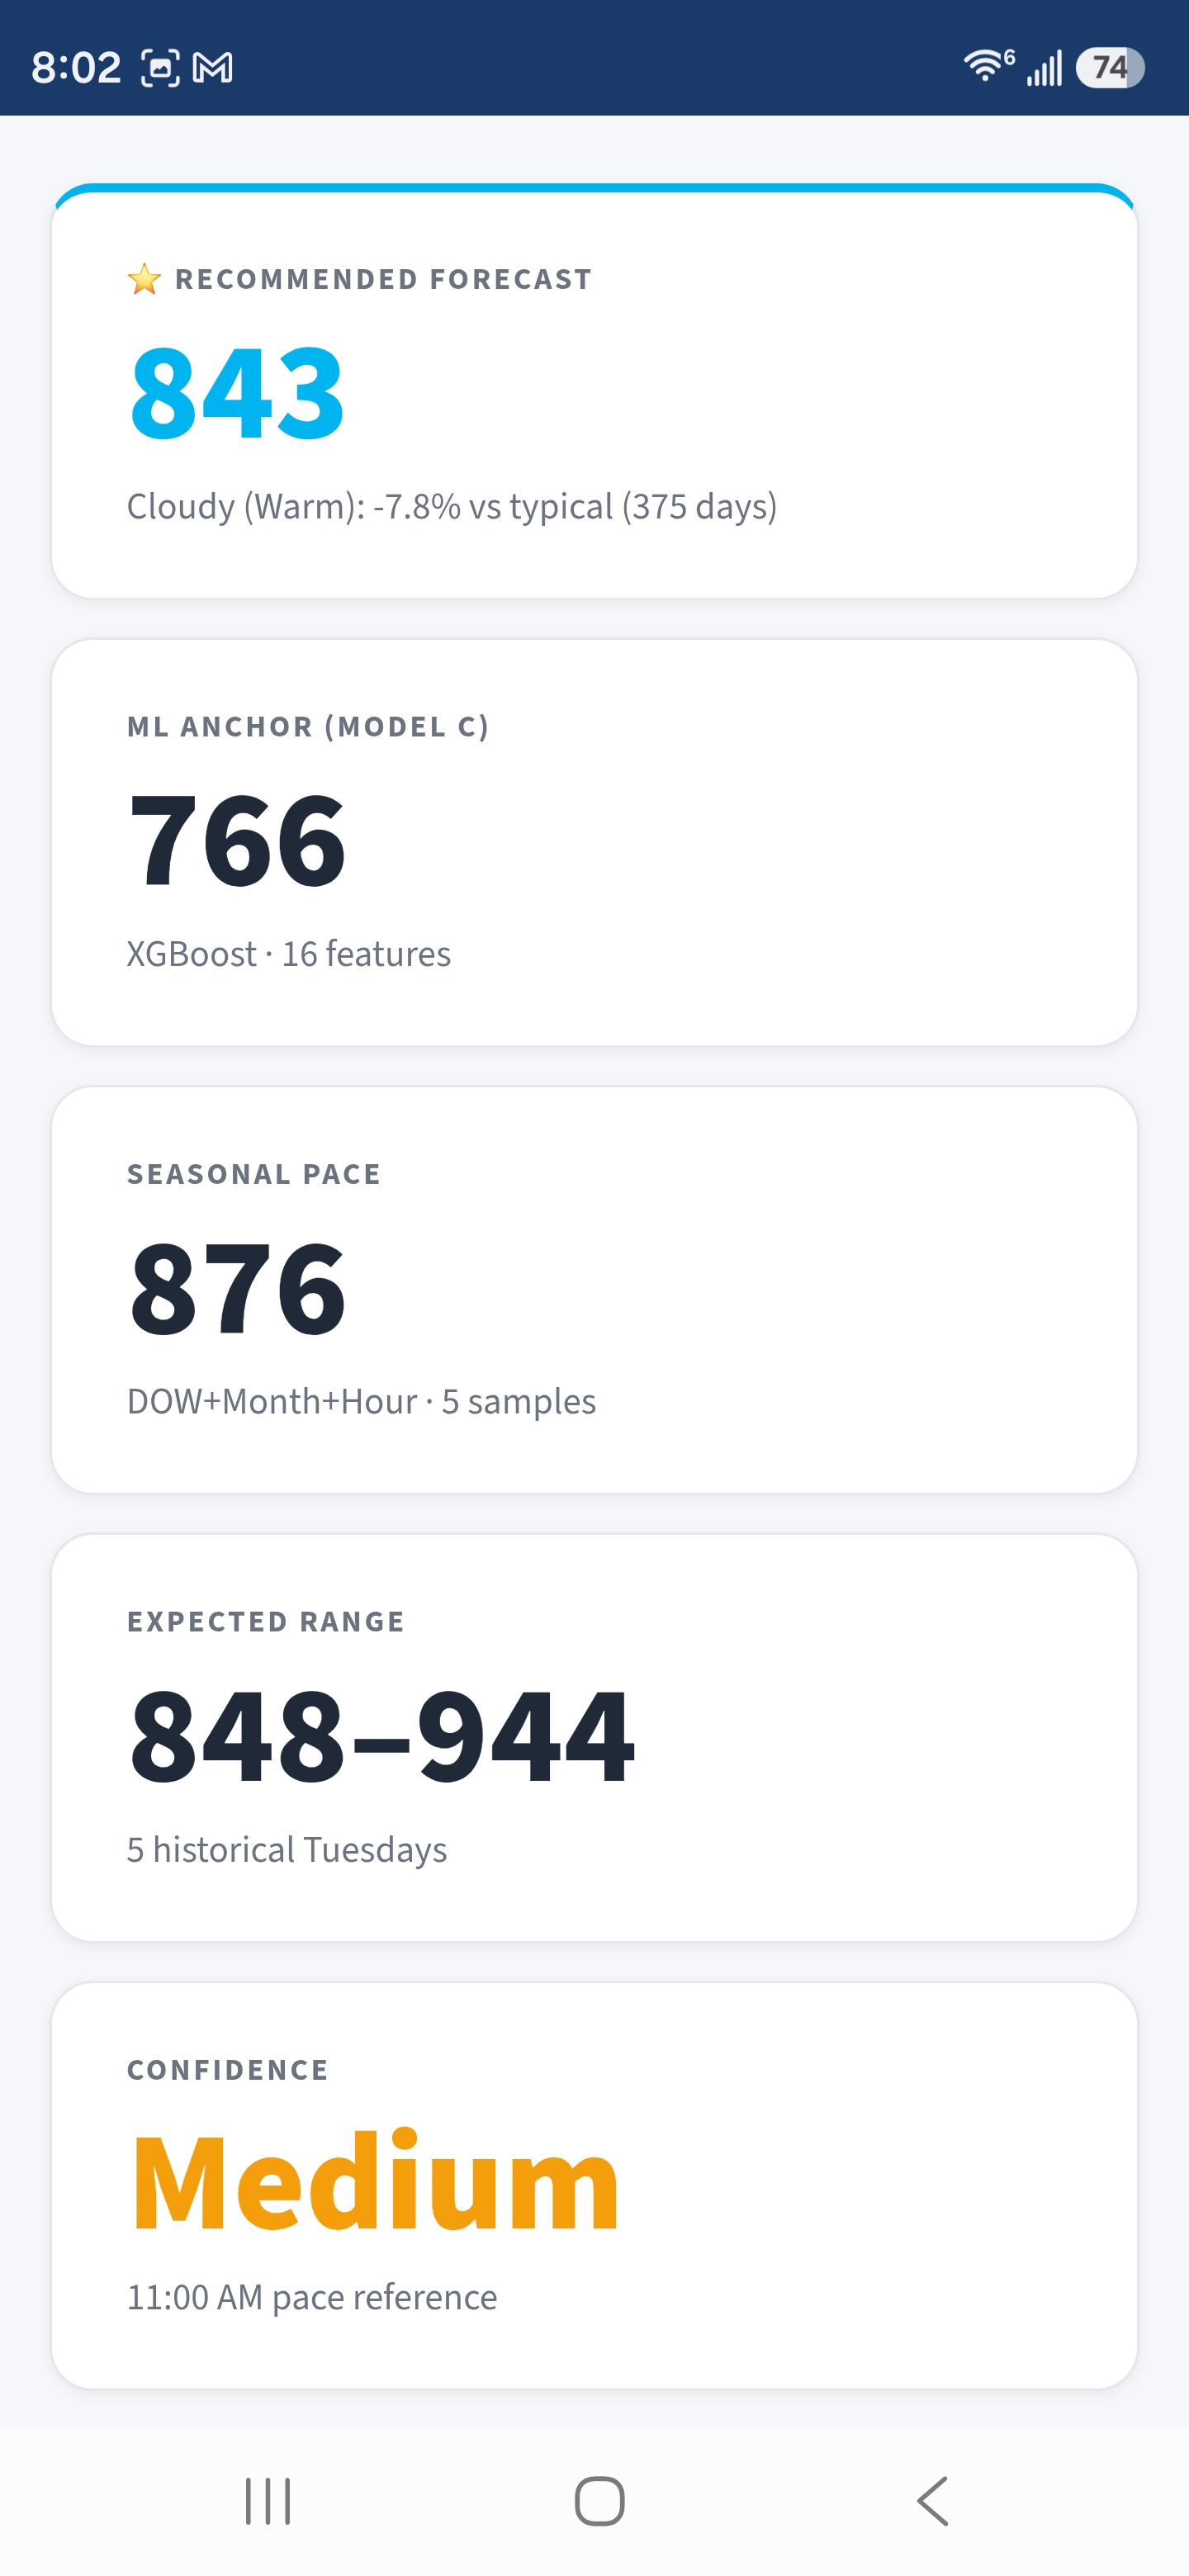
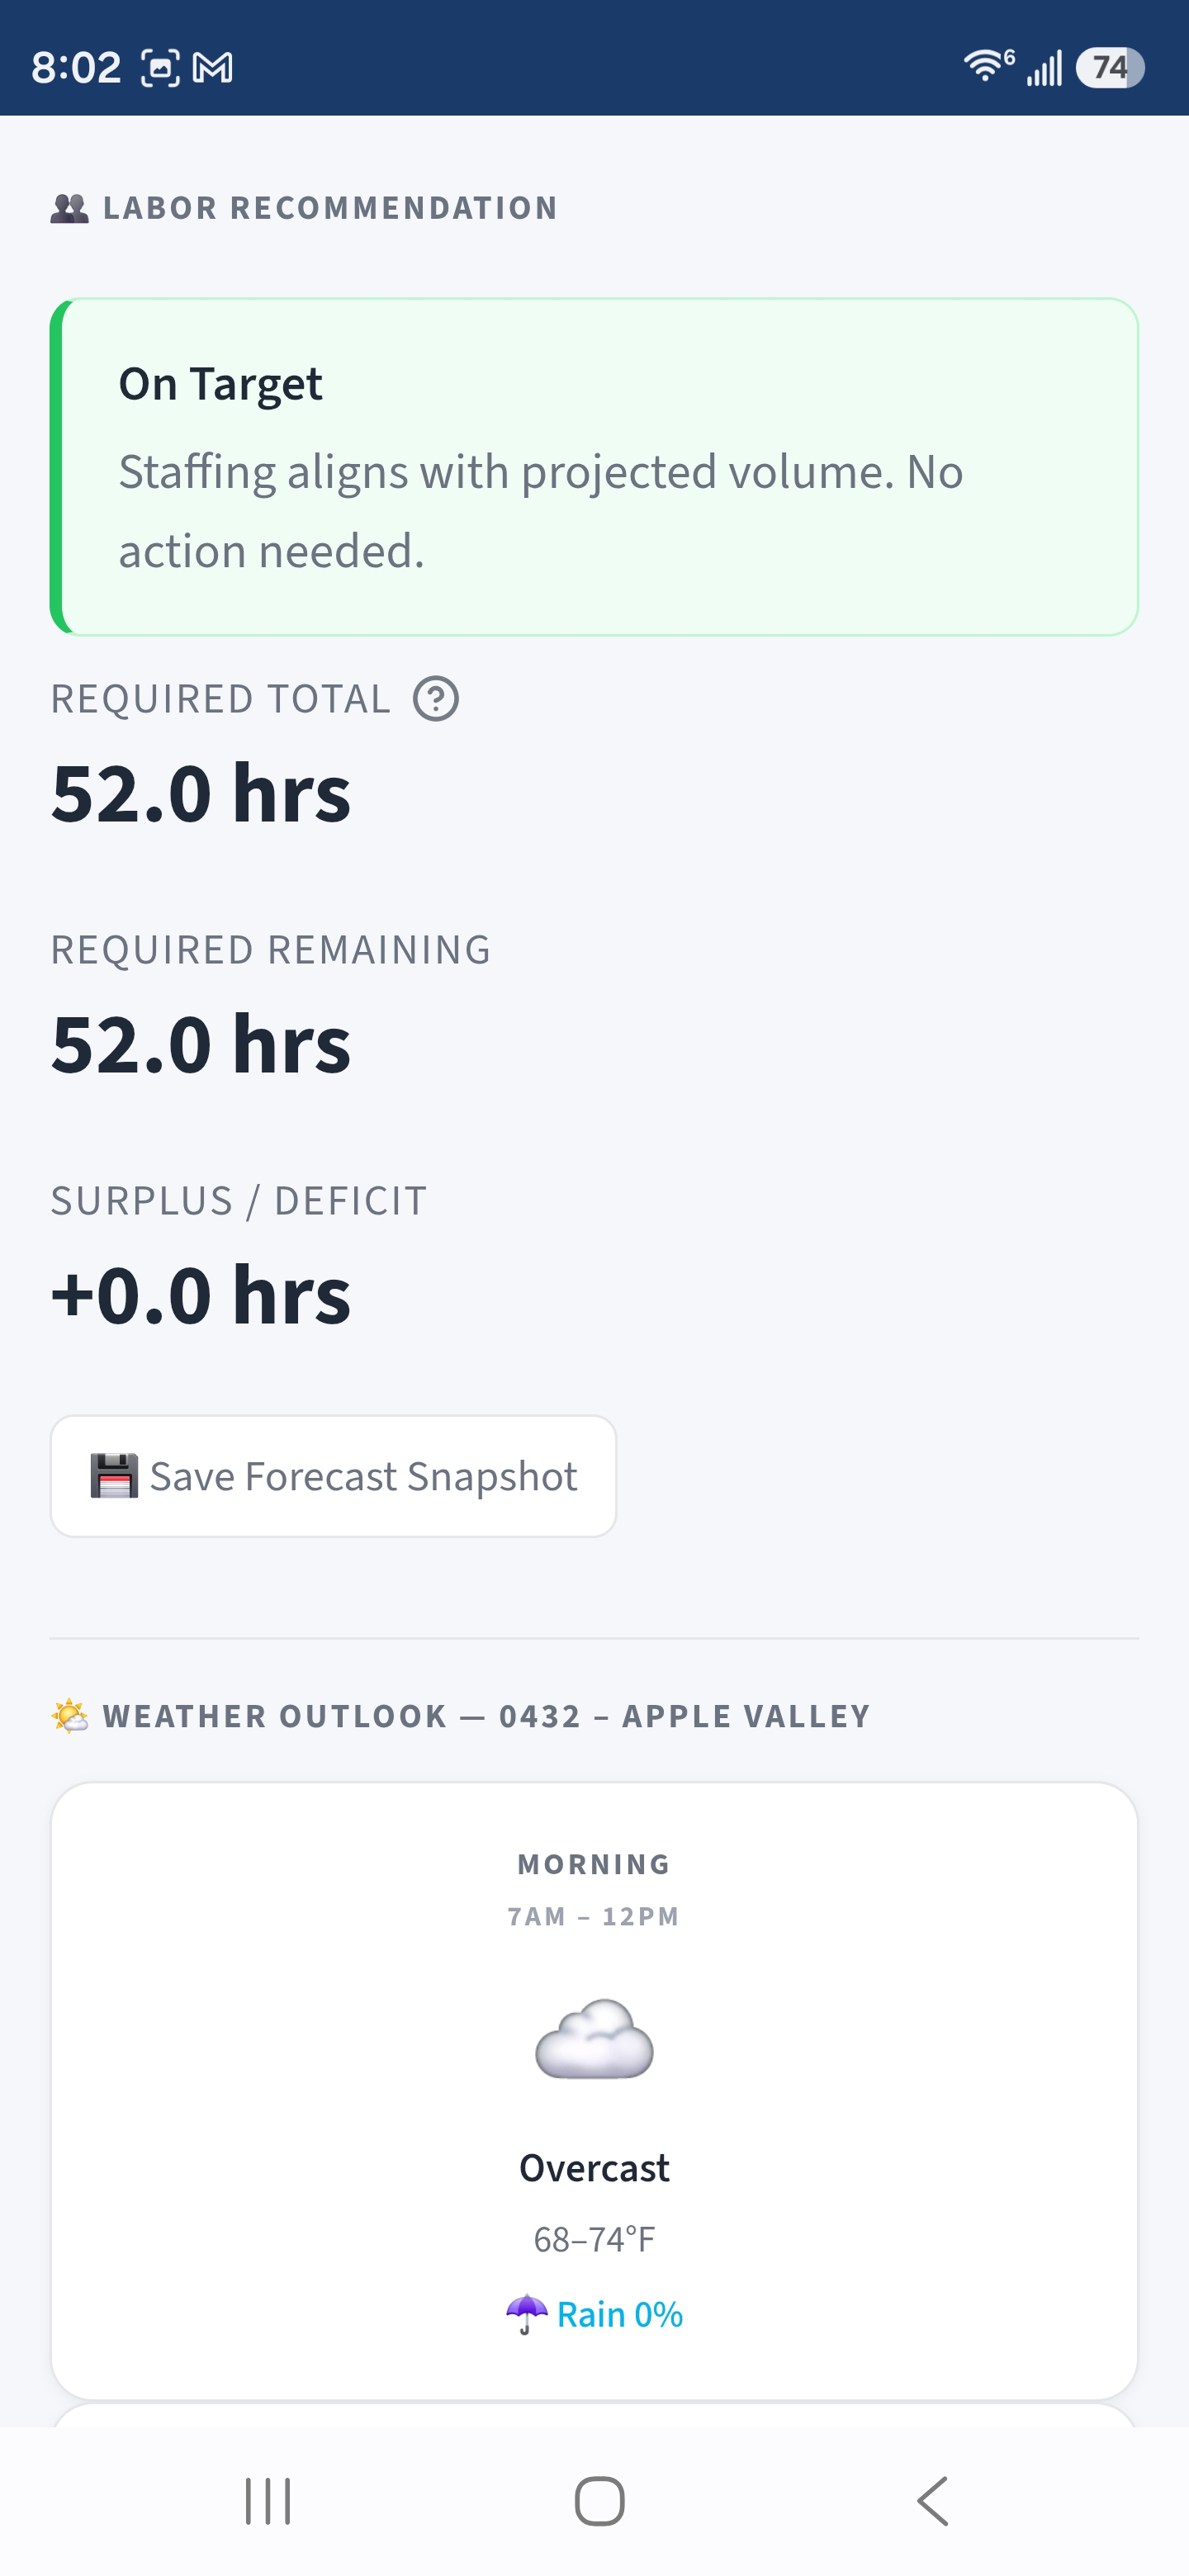
One forecast connects the current pace to the labor decision. Managers can see the expected finish, its likely range, the confidence level, and whether scheduled hours align with projected demand.
The daily workflow
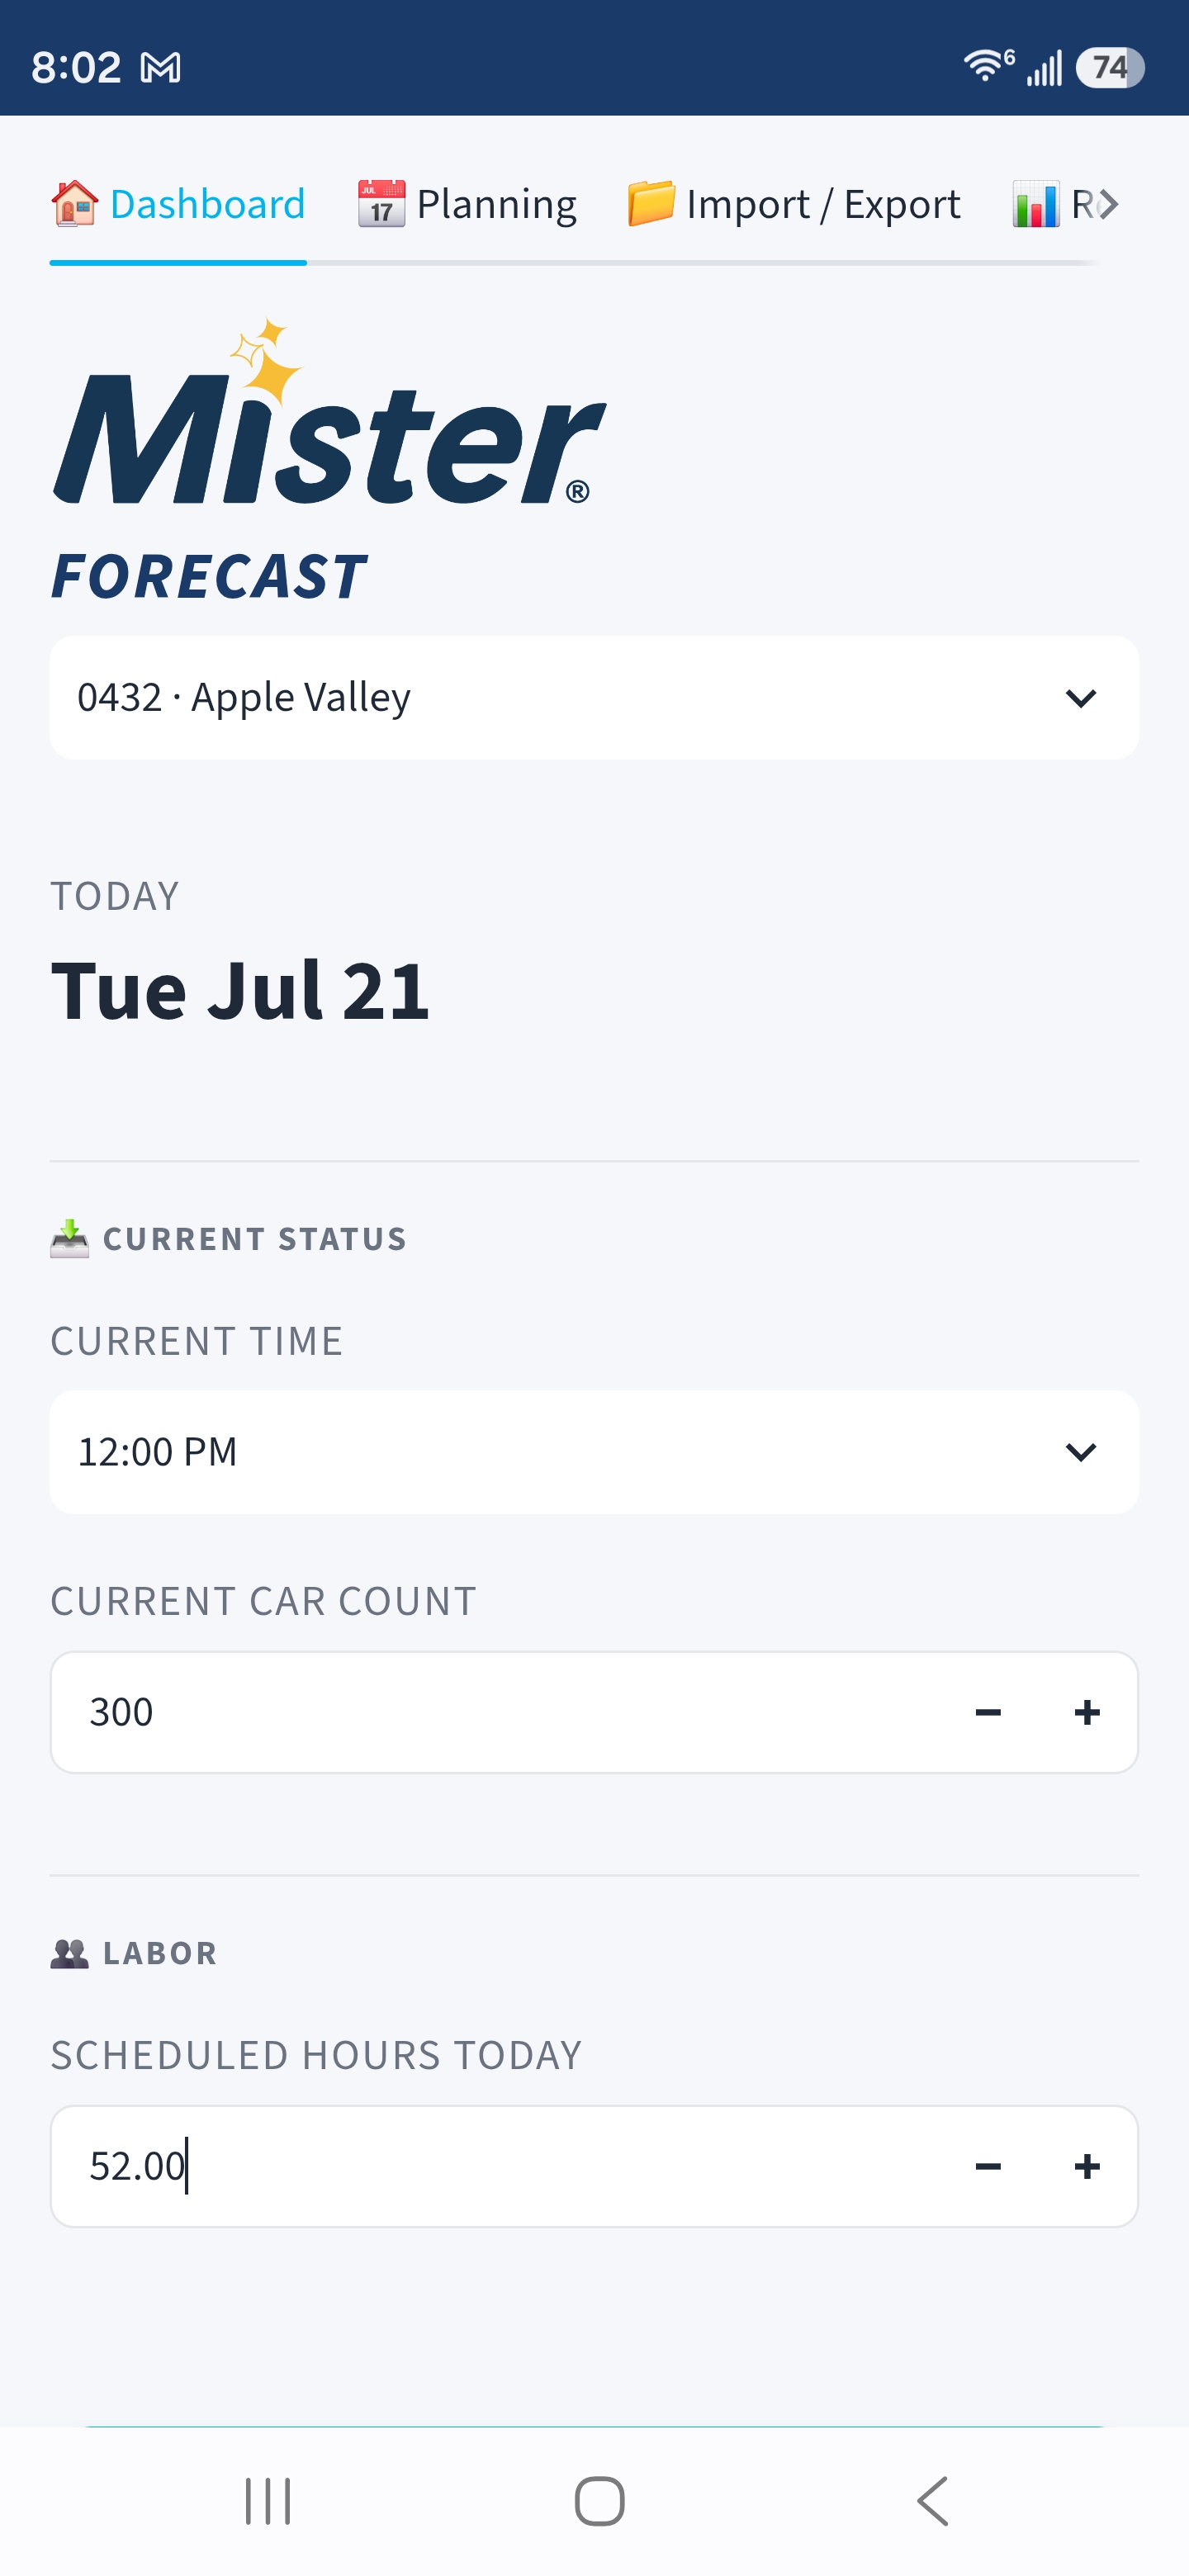
The mobile experience keeps the essential interaction focused. A manager enters the current time, car count, and scheduled hours, then receives a finish forecast and direct labor guidance.
How it works
The system combines live traffic with seasonal pace, weather effects, recent trends, and a machine learning forecast. As more of the day unfolds, observed pace carries more weight. The interface translates that forecast into clear staffing guidance.
Historical traffic, hourly progress, weather, calendar effects, and the current day.
Seasonal patterns and machine learning estimate the most likely finish and range.
Labor guidelines turn the forecast into a direct recommendation for the operator.
Saved forecasts are matched with actual results so performance remains visible.
What shapes the forecast
The forecasting system combines calendar timing, recent operating patterns, local school schedules, and detailed weather signals. It also applies operating rules for known exceptions and translates raw weather into conditions that are meaningful to the business.
Sixteen weather categories distinguish conditions such as extreme cold, snow, fog, thunderstorms, different levels of rain, wind, temperature bands, and cloud cover. The day before a holiday, the holiday itself, the day after, and very low volume closure days are excluded from normal seasonal averages so unusual events do not distort future projections.
Build the schedule
The weekly outlook shows projected cars, recommended labor hours, recent business pace, weather, and the expected demand for each day. It gives the manager a practical starting point for building the upcoming schedule.
Connected planning
The Import / Export workspace keeps forecast data current and prepares weekly projections for Goals Flow or a downloadable planning file.
Visible operating logic
Managers can see the volume tiers and hour ranges behind the recommendation, keeping the decision consistent and understandable.
Outcome
Forecast Flow is fully operational for Apple Valley, where the forecast is grounded in location specific history and daily use. The location framework and weather coverage are prepared for the 37 Minnesota region sites, but each additional location will require its own operating data and validation before going live.
The 19.6% figure is the current 30 day performance displayed in the supplied product screenshot. It is not presented as an all time or guaranteed result.
Measure the result
The accuracy view tracks recent performance, short term direction, and daily results so managers can evaluate the system using real operating outcomes.
Product judgment
The forecast does not stop at a number. It shows the expected range, confidence, seasonal pace, and labor impact so the manager can understand the recommendation before acting.
Forecast Flow also separates historical analysis from real operational performance. A forecast is only useful if the team can understand when it was made, what information shaped it, and how it performed.
Next case study